We are now leaving the realm of classical statistics, employing a concept that it is not equipped to deal with: interventions.
Imagine some kind of real-world system from which you can measure values at different points. Such a system could be the health metrics of your body that you are tracking. For example, say you are measuring your body fat, your calorie consumption, your hours of exercise, consisting of a mixture of cardio and strength training, and also some other additional metrics.
At some point you are interested in the specific bivariate relation between your exercises and body fat. Looking at the weekly averages, the model specific to your case that connects those two metrics could look like this:
Body fat = -0.3 * weekly hours of exercise + 23 + Epsilon
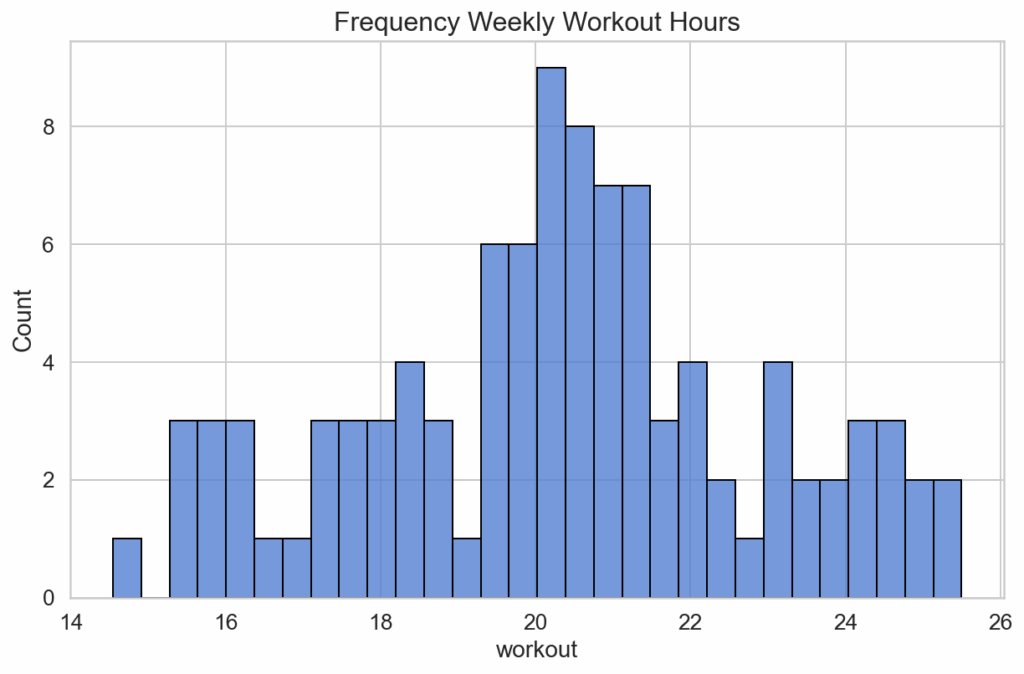
with Epsilon comprising all other unknown causes with an impact on your body fat. Of course, prior to analysis you don’t know that specific coefficient of -0.3, but you do some research and estimate it. The value is negative, given your exercise does burn also calories stemming from your fat deposits. You know that your workout time typically peaks around 20 hours per weeks, so you create a distribution around that value and also a diagram that is based on your hypothetical regression formula:

But then, after collecting some actual data about your exercise, your body fat, and some more variables that could be of interest, you see the following relation between your two selected variables:
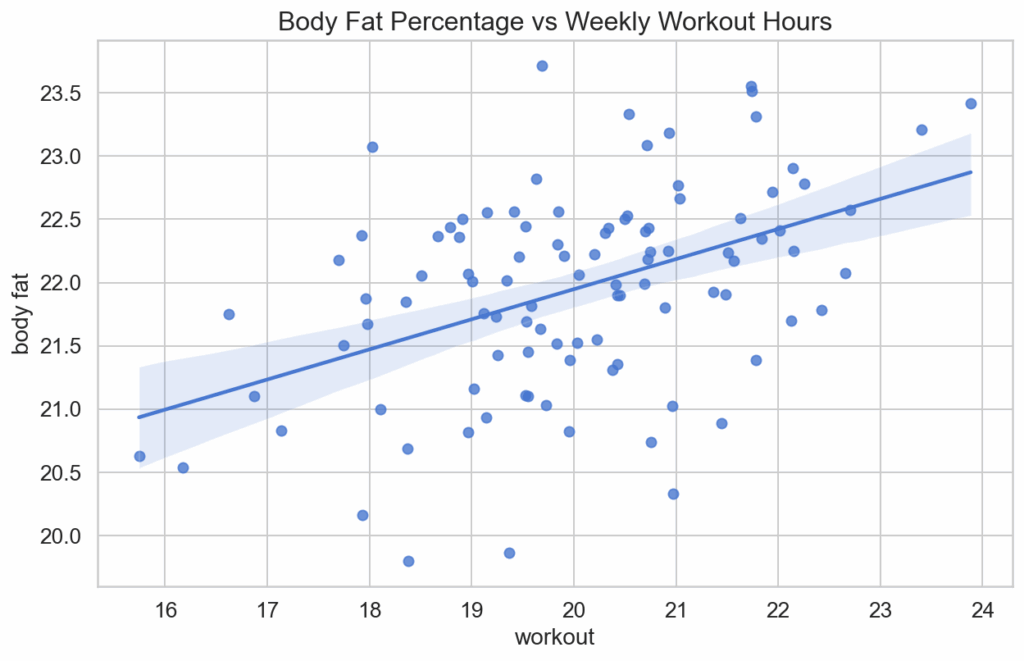
The regression line through your scatter plot indicates a positive correlation between your exercise and your body fat. Does being a data-driven decision maker make you reduce your hours of exercise in the light of these data? Of course not, since the bivariate correlation analysis does not do the job properly. Increasing the exercise will in fact reduce the body fat, contradicting the first analysis done on the data. As it turns out, adding the consumption of bad calories as a third variable to the model is a step towards a truer picture of reality. With this third variable we can establish another system of equations:
Body fat = – 0.3 * weekly hours of exercise + 0.6 * caloric energy per week in Mcal +16 +Epsilon
Hours of exercise = 0.75 * caloric energy per week in Mcal + 5 + Epsilon
These new pieces of information explain the seeming contradiction between measured data and our background knowledge. Whenever we have consumed an excess in calories, this triggers us to go make our exercises, and without being driven by bad consciousness we are not much motivated to do so.
In this toy examle with synthesized data, we can extract the relevant bits and recover the expected negative correlation between hours of exercise and body fat, by holding fixed the consumption of bad calories so that only variation in the other two variables remains. Under that operation, the expected results obtains:

The example is of course oversimplified in terms of the causal equations and unrealistic in terms of the extreme and mono-causal influence of the calorie consumption on your willingness to exercise. Also, it is more realistic to assume a circular relation between those two variables rather than a one-dimensional one. But the simple causal structure contrived already shows that correlations between variables extracted from observational data does not readily give you a valid recommendation for a policy to reach your goals. You first have to adjust your data for the “causal bias”, in the example the kinds of situations where you actually start with your exercises. These situations are already negatively impacted by higher calorie consumption compared to the situation where exercise is not done. The standard of experiments where such a bias does not obtain is called randomized trial, or A/B test, which is the topic of the next article.